The Charts
First, the cumulative views (inspired by TechPresident's Youtube charts) and other cumulatives for the frontrunner candidates.


Now for the averages sans outliers to reflect true user loyalty to each candidate (an explanation on the outlier data and why they're removed can be found here).


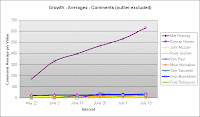
Here are the growth graphs showing actual growth in various user activities for each candidate since May 22. All candidates have been now been added to these growth charts.
 Channel Views Channel Views |  Cumulative Ratings Cumulative Ratings |  Cumulative Comments Cumulative Comments |
 Cumulative Views Cumulative Views |  Subscribers Subscribers |  Ratings Averages Ratings Averages |
 Comments Averages Comments Averages |  Views Averages Views Averages |
As usual, Paul's numbers are blowing the curve. If you want me to remove Paul's data to look at the actual growth of the other candidates, let me know in the comments.
Previous entries:
July 1, 2007: GOP Candidates YouTube Stats - 07/01/07
June 21, 2007: GOP Candidates YouTube Stats - 06/21/07
June 11, 2007: GOP Candidate YouTube Stats - 06/11/07
June 2, 2007: GOP Candidate YouTube Stats, Charts (Followup)
May 22, 2007: About those Youtube Stats...

No comments:
Post a Comment